Visit the shop to buy this issue’s print edition or poster!

Products of a system are generally expected to have a certain rigidity. A system is ostensibly a rational enterprise, meant to achieve its objective with greater efficiency than the improvisations of an unsteady human hand. And with that absence of improvisation comes an absence of character and warmth. After all, though the system may have been created by humans, its products are at least one step removed from that humanity: Les Paul’s signature may be on your guitar, but Les Paul himself almost certainly never touched it, and he may never have even entered the factory that produced it.
My Plus Equals explorations so far have mostly embraced the rigidity their combinatorial systems produce (Fig. 1). Like their forebears in the conceptual and minimalist art movements, they’re a counterpoint to the gestural immediacy of something like abstract expressionism, and their mechanical lines and comprehensive seriality constitute their own kind of regulated beauty. That said, the systems I devise don’t have a mandate to make stiff work, and the prospect of finding something akin to gestural immediacy within a rigid structure is a contradiction that interests me. And one fundamental way to explore that contradiction is to look at the relationship between straight lines and curves.
While working for the automaker Citroën in 1959, the French physicist and mathematician Paul de Casteljau developed a method for computationally describing and creating curved lines. A short time later, an engineer named Pierre Bézier independently made the same discovery and applied it to the design of automobile bodies at Renault, another French car company. Unlike de Casteljau, Bézier didn’t hesitate to publish his findings, and so the method, which is still widely used today in the design of everything from fonts to video games to the aforementioned Les Paul guitars, became known as the Bézier curve.
Bézier curves come in a few different flavors, and the one best suited to my purpose is the cubic Bézier curve. It’s defined by four points on a plane: two end points—let’s call them A and D—and two control points, B and C (Fig. 2). The positions of the end points determine the beginning and end of the curve, and through a process of linear interpolation, their spatial relationships with the positions of the control points determine the shape of the curve itself. To see how it works, first draw straight lines between A and B, B and C, and C and D (Fig. 3). Next, mark the midpoint on each of those lines and draw lines connecting the AB midpoint to the BC midpoint, and the BC midpoint to the CD midpoint (Fig. 4). Finally, mark the midpoints of those lines and draw one final line connecting those midpoints. The midpoint of that final line, which we’ll call P, is the midpoint of the curve (Fig. 5). If we keep the original four points in the same positions, but redraw the rest of the apparatus, this time placing the interior points 25% of the way across the connecting lines, P now marks the 25% point on that same curve (Fig. 6). Redraw the apparatus enough times, moving the interior points incrementally each time, and P will eventually shape the entire curve between A and D. (Fig. 7).
A chain of curves produced in this manner can form any shape imaginable (Fig. 8), and to do so by applying a relatively simple algorithm to a limited number of point coordinates is incredibly powerful, so it’s not hard to see why the discoveries of de Casteljau and Bézier have been so influential. (For a deeper dive into Bézier curves, I highly recommend Bartosz Ciechanowski’s interactive explainer, “Curves and Surfaces,” and/or Freya Holmér’s video, “The Beauty of Bézier Curves.”)
Bézier curves have the potential to give me what I’m looking for: Their end points and control points can be plotted according to a strict system, and the resulting curves can still evoke the looseness of human gesture.
The foundation of my strict system is a 3×3 grid. The first part of the plan is to find every possible sequence of points within that grid, where 1) each sequence starts at the same point, 2) each point is a distance of 1×2 or 2×1 grid units away from the point preceding it, and 3) no point is used more than once in a sequence. Each sequence will plot the end points for a chain of Bézier curves.
I begin by choosing point 2,2 as a somewhat central origin point for all sequences. There are four points in the grid that are the specified distance from that point: 0,1, 0,3, 1,0, and 3,0 (Fig. 9). These make the beginnings of four sequences, and each of them is able to branch out to one or more additional points (Fig. 10). Any time a sequence has more than one candidate for its next point, a new sequence is formed for each additional candidate (Fig. 11). A sequence is complete when it reaches a dead end (Fig. 12). This process ultimately produces 562 distinct sequences, with lengths ranging from four to 14 points.
Now for the control points, which will be positioned on the same grid. Using the same point names from our earlier Bézier curve demo, I’ll place each B control point one grid unit away from its corresponding A end point, and likewise, I’ll place each C control point one grid unit away from its corresponding D end point. To give the curves some variety, the control points can be positioned horizontally, vertically, or diagonally, relative to their corresponding end points (Fig. 13).
The control points could simply cycle through those directions: the first end point in the sequence gets a horizontal control point, the second is vertical, the third is diagonal, the fourth is horizontal, the fifth is vertical, and so on. However, many of the end point sequences are identical to each other apart from their last few points, and having every sequence use one directional cycle for their control points would make most of their curves identical too. If I’m going for an effect of spontaneous gesture, that kind of repetition won’t help (Fig. 14).
So I made a set of six different directional cycles (Fig. 15). The first end point sequence’s control points use the first directional cycle, the second sequence uses the second cycle, and so on. This allows similar sequences of end points to produce very different curves (Fig. 16).
With repetition obscured and variety achieved, the final product is a series of 562 scribbles that you might not have guessed were all drawn by an algorithm (Fig. 17).
One of the first things I noticed about this series is that despite the uniqueness of its individual scribbles, they all seem to have a consistent personality. Throughout the series, the system generates some loose motifs, which imbue the scribbles with a shared character, as if they collectively represent one person’s handwriting in the absence of an alphabet. And that person seems to be expressing something, albeit in a subtly regimented manner. It’s not hard to see in these scribbles anger, joy, confusion, or even boredom, and yet these emotional qualities never manage to empower the scribbles to escape their confinement. They all occupy their uniform allotted space with robotic obedience.
As much as I’m enjoying the discoveries that come with venturing into seemingly spontaneous and organic combinatorial forms, I’m ambivalent about the achievement.
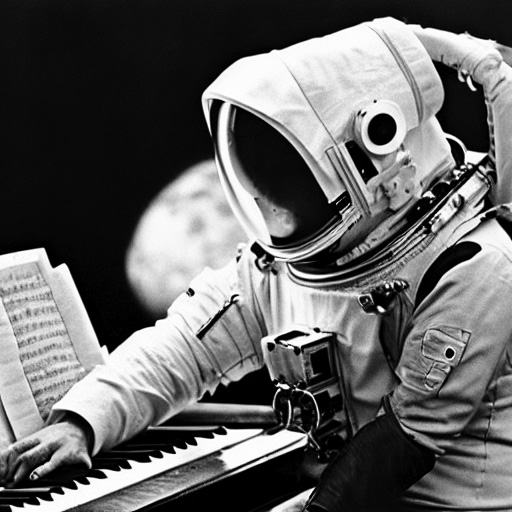
Artificial intelligence has made real strides this year, most noticeably in the form of machine learning models that generate digital images from natural language descriptions. These models have been trained to associate images with relevant words by studying hundreds of millions of captioned pictures. When given a descriptive prompt, like, say, “Photo of an astronaut playing the piano, in the style of Dorothea Lange,” they can generate photorealistic images in mere seconds that render that scene with startling accuracy (Fig. 18). As a landmark technological advancement, it’s in line with what we’ve come to expect from Silicon Valley, in that it’s both amazing and unnerving, shaped by deep pockets and fanciful libertarian ideals, and there’s no shortage of reasons to be skeptical that we’re ready for its implications.
The trajectory of the internet over the last 30 years—from its techno-utopian colonization in the 1990s, to its capitalist co-option in the 2000s, to its obliteration of the very notion of objective truth in the 2010s—has made Luddites out of many of us who were once optimistic about its promise. It’s hard to square the undeniably positive effects of computers’ growing ubiquity with their ability to enable harm at a previously unimaginable scale. AI has the potential to cure disease, feed the world, and amplify our imaginations. But can it avoid embodying our worst biases and being weaponized for targeted abuse, the spread of disinformation, and who knows what else? Can it re-establish our social safety net with the same speed it displaces workers? Can it reshape our ideas around authorship and ownership?
The series of scribbles I’ve generated here is obviously nowhere near the level of sophistication of artificial intelligence. But it does live somewhere in the uneasy realm of computers pretending to be human. We’ll all be living in that realm eventually. Here’s hoping that against the odds, it’s a harmonious one.
Rob Weychert
rob@robweychert.com
Visit the shop to buy this issue’s print edition or poster!